Free URLGenius Alternative: MySocial SmartLink
MySocial SmartLink vs URLGenius for deep linking. Free tier, pricing, features, and which tool opens your content in-app instead of the browser.

Quick answers
1-3% is average, 3-6% is good, and 6%+ is excellent. Nano-accounts under 10K followers average 5.2% engagement, while accounts over 100K typically see 1-2%. Engagement is calculated by dividing total interactions (likes + comments + saves + shares) by reach, then multiplying by 100.
Instagram uses separate ranking systems for Feed, Reels, Stories, and Explore. The top three signals across all surfaces are watch time, shares via DM (the strongest signal), and likes. Saves and multi-word comments carry more weight than passive likes. Original content gets 40-60% more distribution than reposts.
Carousels lead at 0.55% average engagement and drive the most saves. Reels follow at 0.52% but deliver 2.25x more reach than static images, making them best for discovery. Static photo posts have declined 17% year-over-year to 0.37% and should be deprioritized.
3-5 Reels per week, 2-3 carousels, and daily Stories is a strong baseline. Consistency matters more than volume — accounts that post on a regular schedule outperform those that post in bursts. Quality content that drives saves and shares will always beat high-volume, low-effort posting.
Less than before. Instagram now relies primarily on visual AI, caption keywords, and interest-based signals for discovery. Use 3-5 targeted hashtags for niche reach, but invest your energy in hooks, retention, and share-worthy content. Hashtag strategy alone will not move the needle.
Instagram engagement dropped 28% year-over-year through 2025 (Social Insider). The average engagement rate across all industries sits at just 0.48-0.79% — down from 2.94% in 2024. The platform is not broken. The algorithm has simply changed what it rewards, and most creators have not adapted.
The accounts that are still growing are not posting more. They are posting differently — optimizing for the signals the algorithm actually cares about in 2026: watch time, shares, and saves. Likes are now the weakest signal. If your entire strategy is “post good content and hope people like it,” you are optimizing for the wrong metric.
This is the complete framework for understanding how Instagram ranks content and the specific tactics that drive engagement in 2026.
28%
Year-over-year engagement decline across Instagram
5.2%
Average engagement for nano-accounts under 10K
2.25×
More reach from Reels vs. static images
0.55%
Carousel engagement rate — highest of any format
Instagram does not have one algorithm. It uses separate ranking systems for each surface — Feed, Reels, Stories, and Explore — each optimized for different user behaviors (confirmed by Instagram head Adam Mosseri). Understanding which signals matter for each surface is the foundation of any engagement strategy.
The 3 Signals That Determine Your Reach
Shares via DM
When users send your post to a friend, Instagram treats it as the strongest quality signal
Watch Time
Average time spent per view — a Reel watched 50% by 1K people outranks one watched 10% by 5K
Saves & Comments
Saves indicate reference value. Comments with 4+ words carry more weight than emoji reactions
Likes rank last. A post with 500 likes and 200 shares outranks one with 1,000 likes and zero shares. Stop optimizing for likes — optimize for shares and saves.
Algorithm Signals by Surface
Feed
• Relationship strength
• Post recency
• Engagement velocity
• Caption dwell time
Reels
• Watch time / completion
• Rewatches
• Shares via DM
• Original content score
Stories
• Viewing history
• Engagement frequency
• Relationship closeness
• Tap-forward rate
Explore
• Past user behavior
• Content similarity
• Virality signals
• Topic authority
Before optimizing, you need to know your baseline. Engagement rates vary dramatically by account size — nano-accounts outperform macro accounts by 3-5x because they have tighter, more invested communities.
Average Instagram Engagement Rate by Account Size
Engagement rate
0% to 6%
Account size
Nano (<10K)
5.2%Micro (10K-50K)
3.2%Mid (50K-200K)
2.1%Macro (200K-1M)
1.3%Mega (1M+)
0.8%Source: InfluenceFlow, Outfame — 2026
Quality ratings for your engagement rate:
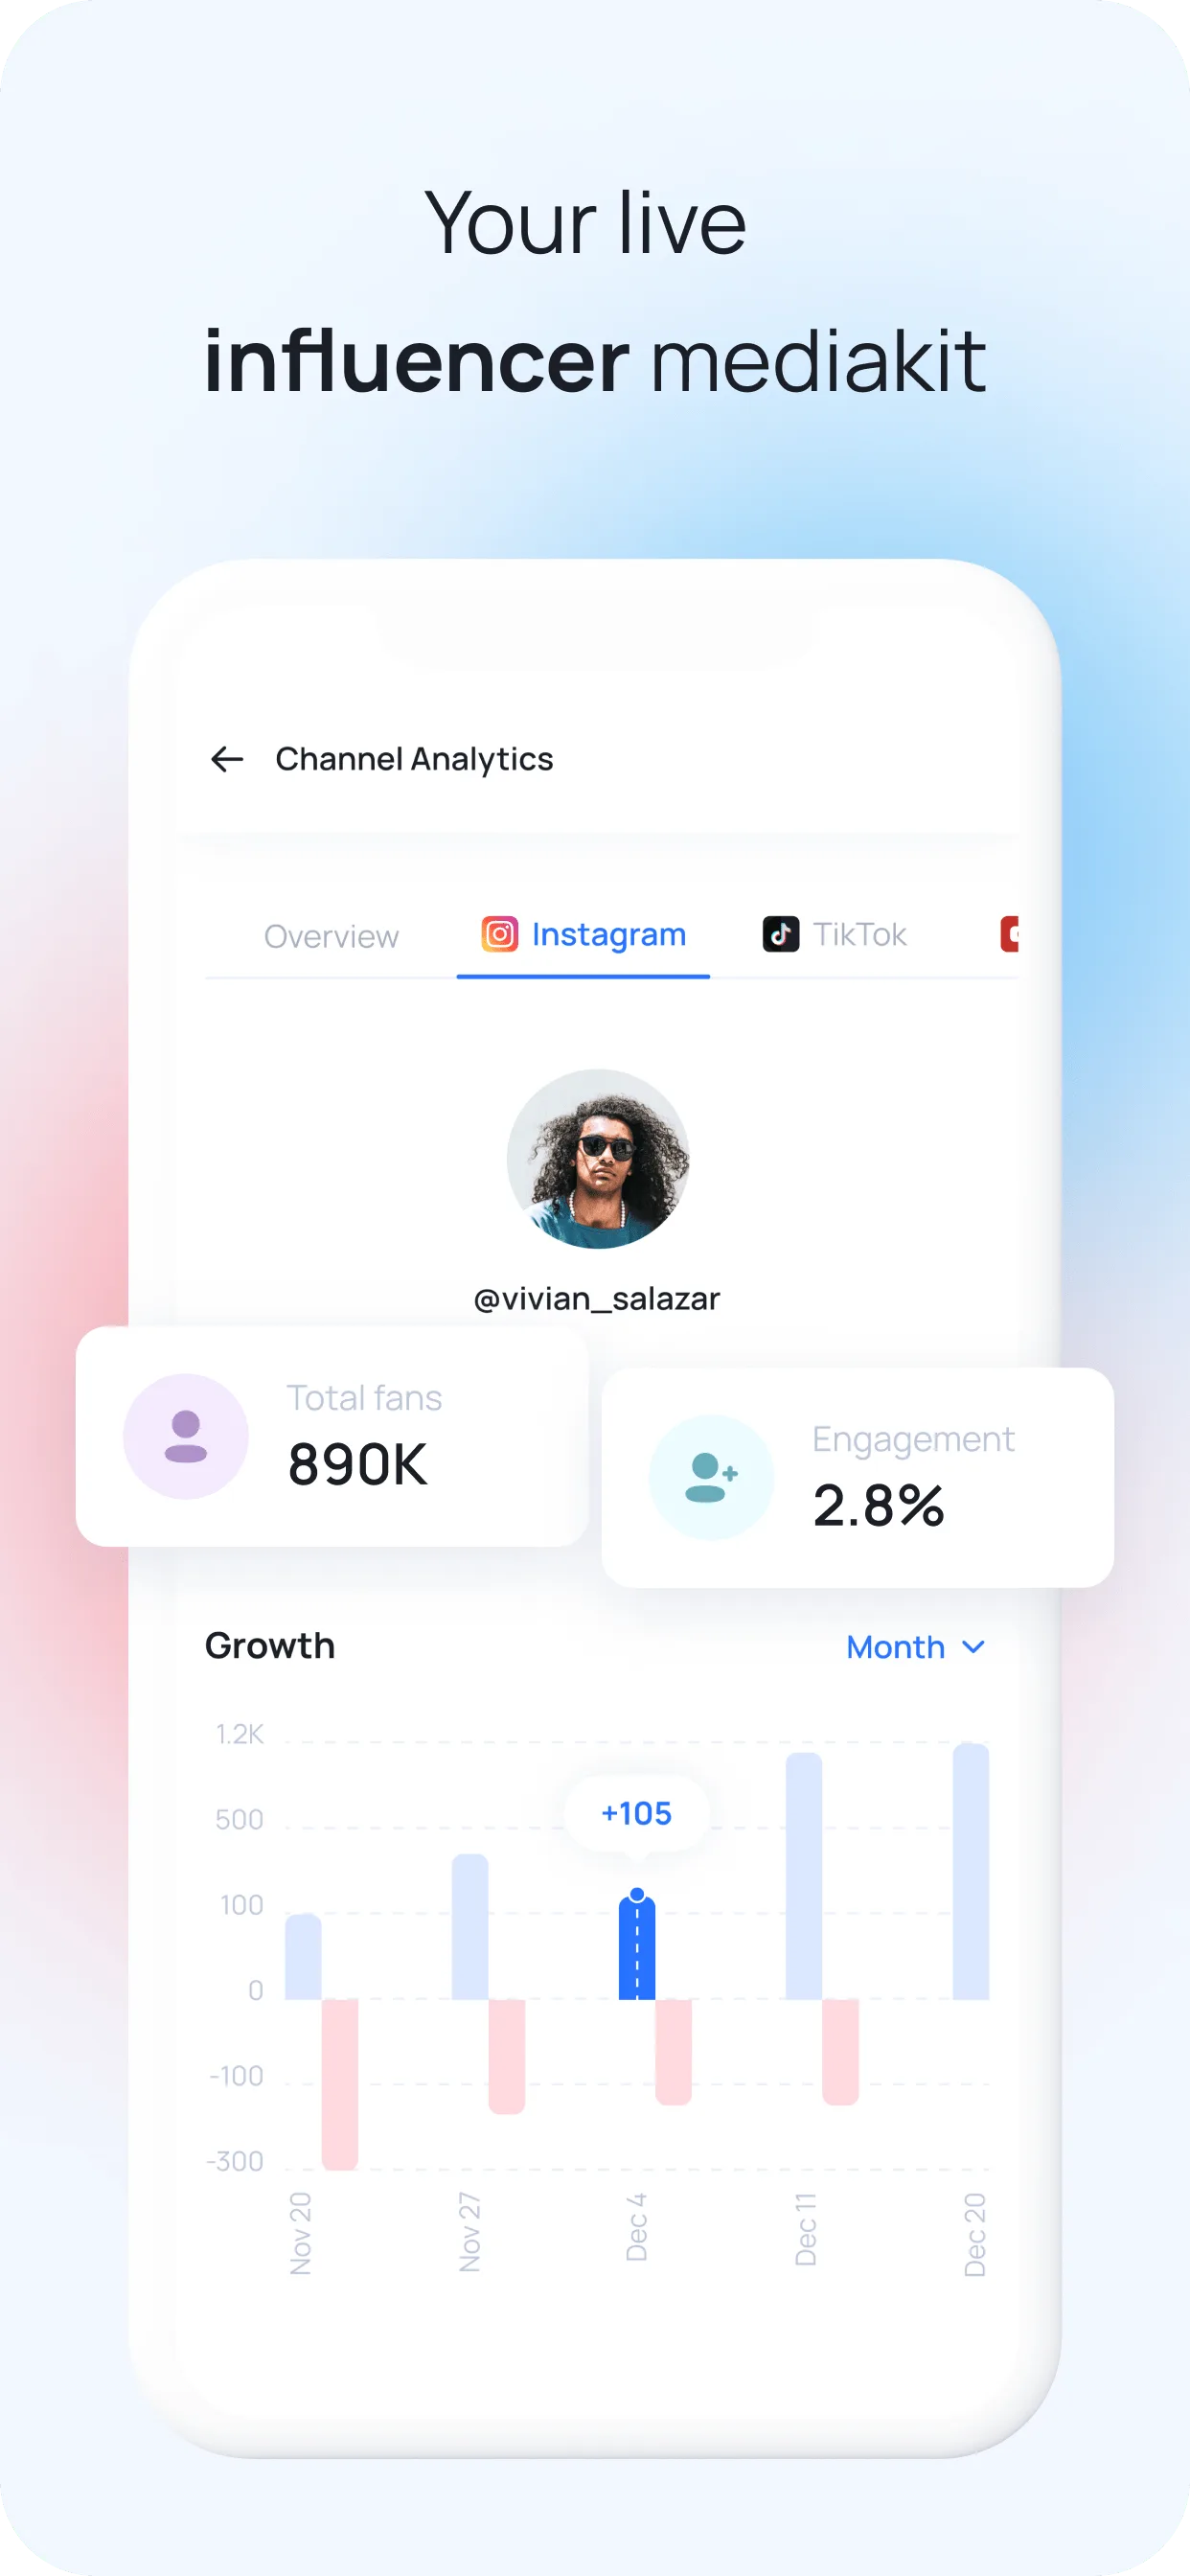
Use a media kit with auto-updating analytics to track your engagement rate over time. Brands and sponsors check this number before anything else.
Not all content formats are created equal. In 2026, each format serves a different purpose in your engagement strategy. The winning approach is format diversity — accounts that post across Reels, carousels, and Stories outperform single-format accounts (Social Insider).
Your discovery engine. Reels reach 2.25x more people than static images and are the algorithm’s preferred format for non-followers. Use them to attract new audience.
Your save machine. Carousels drive the highest engagement rate and the most saves of any format. 5-10 slides is the sweet spot. Use them to build authority and teach.
Your relationship builder. Stories reach your existing followers and maintain closeness. Polls, questions, and interactive stickers drive reply-based engagement that strengthens your feed ranking.
Step 01
Shares via DM are the #1 algorithm signal in 2026. Every piece of content you create should pass the 'would someone send this to a friend?' test.
• Hot takes that spark opinion ('Unpopular opinion: posting daily is hurting your engagement')
• Relatable moments your audience sees themselves in
• Useful tips someone would save or forward
• Data or stats that surprise ('Instagram engagement dropped 28% this year')
The test: Before posting, ask — would this make someone hit the share button? If not, rework the hook.
Step 02
A Reel watched 50% by 1,000 people outranks one watched 10% by 5,000 people. The algorithm rewards average watch time per view, not total views.
• Open with a pattern interrupt — movement, text on screen, or a bold claim in the first 0.5 seconds
• Create loops where the ending connects back to the beginning (rewatches = massive boost)
• Keep Reels under 30 seconds for completion rate, or go 60-90 seconds for depth — avoid the awkward middle
• Use on-screen captions — 80% of Reels are watched with sound off
Metric to track: Average watch time in Instagram Insights, not total plays.
Step 03
Instagram now weights caption dwell time — how long users pause to read your caption. Longer engagement = stronger signal.
• Hook (line 1): Bold claim, question, or surprising stat that earns the 'more' tap
• Value (lines 2-6): Story, tip, or insight — short paragraphs, not walls of text
• CTA (final line): Specific question or action — not 'thoughts?' but 'What's the one thing you'd add to this list?'
Keyword-triggered CTAs work best: 'Comment GUIDE and I'll DM you the free template' drives comments and DMs — both strong signals.
Step 04
First-hour engagement velocity is critical for how widely Instagram distributes a post. Every reply you leave counts as a new comment, doubling the engagement signal.
• Reply within 60 minutes of posting — set a timer
• Ask a follow-up question in your reply to spark a thread. Comment depth (replies-to-replies) is an even stronger signal
• Pin your best comments to encourage more conversation
Pro tip: Comments with 4+ words carry more algorithmic weight than emoji reactions (CreatorFlow). Encourage your audience to leave real thoughts, not just '🔥🔥🔥'.
Step 05
Carousels have the highest engagement rate of any format at 0.55%. They also drive the most saves — which signal reference value to the algorithm.
• 5-10 slides is the sweet spot for swipe-through and dwell time
• First slide = hook. Make it bold, provocative, or promise specific value ('7 caption hooks that doubled my engagement')
• Last slide = CTA. Ask for the save explicitly: 'Save this for your next content day'
• Bonus: If someone scrolls past your carousel, Instagram reshows it with the second slide — design slide 2 as a backup hook
Best for: Tutorials, tip lists, step-by-step guides, before/after comparisons, mini-threads.
Step 06
Reels deliver 2.25x more reach than static images and are the primary way Instagram surfaces content to non-followers.
• 3-5 Reels per week is a strong cadence
• Trending audio still matters — but original audio with strong hooks performs equally well
• Cover image should be clean and readable at small size — this determines whether people tap from your grid
• Text hooks on screen within the first 0.5 seconds — most viewers decide to stay or scroll in under a second
Key insight: Reels are no longer optional. They are table stakes for maintaining reach on Instagram in 2026 (Social Insider).
Step 07
Stories do not drive discovery, but they strengthen the relationship signals that make your Feed and Reels posts rank higher for existing followers.
• Post daily — even 2-3 quick frames keeps you at the front of the Stories tray
• Use interactive stickers: Polls, quizzes, questions, and sliders all generate engagement
• Reply to every Story response — this opens DM threads, which are a top-tier relationship signal
• Share behind-the-scenes content — the casual, unpolished stuff that makes followers feel like insiders
Stories → DMs → Feed ranking. The chain works because Instagram ranks Feed content higher for people you have DM history with.
Step 08
Instagram's Collab feature shares a post across both creators' audiences. All engagement (likes, comments, shares) appears on a single post — effectively doubling your reach.
• Find creators with similar audience size (within 2x of your follower count) for the best engagement crossover
• Co-create Reels or carousels — not just photo posts
• Cross-promote in Stories on both accounts on the same day
Use MySocial's creator matchmaking to find like-minded influencers in your niche for collaborations.
Step 09
Engagement velocity in the first 30-60 minutes determines how widely a post gets distributed. Posting when your audience is most active gives you the strongest initial push.
• Check Instagram Insights → Audience → Most Active Times — this is your specific audience's data, not a generic 'best time to post' list
• Test 2-3 time slots over 4 weeks and track which gets the fastest engagement
• Use analytics tools to monitor which days and times consistently drive higher engagement rates
General guideline: Weekdays 7-9am and 6-9pm in your audience's timezone tend to perform well, but your data always beats generic benchmarks.
Step 10
Dead, inactive, and bot followers destroy your engagement rate because they inflate your follower count without engaging. A 10K account with 2K ghost followers has an artificially low engagement rate that hurts algorithmic ranking.
• Review followers quarterly — remove accounts with no profile picture, no posts, and no activity
• Use audience quality tools to identify the percentage of real vs. inactive followers
• Never buy followers — read our guide on spotting fake followers to understand why this destroys accounts
A smaller, engaged audience is worth 10x more than a large, inactive one — both for algorithm ranking and for landing brand deals.
Chase likes as your primary metric — likes are now the weakest algorithm signal
Post only static images — they declined 17% YoY and average just 0.37% engagement
Repost other creators' content — 10+ reposts in 30 days gets you excluded from recommendations
Use generic CTAs like 'thoughts?' or 'link in bio' — be specific about what action you want
Buy followers or use engagement pods — ghost followers destroy your engagement rate and brands can detect it
Post inconsistently — bursts of content followed by silence trains the algorithm to deprioritize you
Optimize for shares and saves — these are the strongest algorithm signals, worth 3x more than likes
Reply to comments within the first hour — your replies count as new engagement and spike visibility
Mix formats: Reels for reach, carousels for saves, Stories for relationship building
Write captions that earn dwell time — hook + value + specific CTA, not 'link in bio'
Create content worth DM-ing — hot takes, useful tips, relatable moments, surprising data
Track engagement rate by format in your analytics and double down on what works
Auto-updating media kit with verified engagement rate, audience demographics, and growth trends. Track your engagement over time and share one link with brands.
Deep analytics dashboard for Instagram, TikTok, and YouTube. Track engagement rate by post type, identify your best-performing content formats, and spot trends before they impact your growth.
Instagram's native analytics. Check your audience's most active times, track reach vs. engagement by post, and monitor follower growth. Available for Professional and Creator accounts.
Benchmark your engagement rate against competitors and industry averages. Useful for understanding where you stand relative to accounts in your niche.
How to Get Brand Deals on Instagram →
Turn your engagement into revenue — the pitch process, rate negotiation, and what brands look for
How to Find Instagram Sponsors →
Where to find brands that pay for sponsored content on Instagram
How to Spot Fake Followers →
Ghost followers destroy engagement rates — learn to identify and remove them
How to Create Social Media Content →
Content creation fundamentals — from planning to production to publishing
MySocial's verified analytics track your Instagram engagement rate, audience quality, and growth trends — with auto-updating data brands can trust.
Get your media kitSocial Media Growth & Algorithms
Related Posts
MySocial SmartLink vs URLGenius for deep linking. Free tier, pricing, features, and which tool opens your content in-app instead of the browser.
A 30-day roadmap to 10K Instagram followers. Profile optimization, Reels strategy, engagement tactics, and analytics-driven growth for creators.

Your Instagram bio link loses followers to in-app browsers. Fix it with deep linking to boost conversions and keep traffic in-app.