
3 Tips for Managing Influencer Relationships
How to manage influencer relationships that drive results -- from creative briefs to communication plans that prevent campaign disasters.

Quick answers
The average ROI across influencer marketing is $5.20 per $1 spent. YouTube campaigns tend to outperform this because of the long-tail effect — sponsored videos continue generating views, clicks, and conversions for months or years after publishing. Top-performing YouTube campaigns achieve 11:1 ROI or higher.
Track six core metrics: audience retention (what percentage of viewers saw your product mention), engagement rate, click-through rate from description links, conversion rate via UTM links and promo codes, cost per view (CPV), and long-tail view accumulation over 30/90/365 days.
YouTube videos are evergreen — they accumulate views for months or years through search and recommendations. A 30-day measurement window captures only 40-60% of total campaign value. Last-click attribution also undervalues YouTube because viewers often convert days or weeks after watching.
Request the audience retention graph (shows exactly when viewers dropped off relative to your product mention), traffic sources breakdown, audience demographics (age, gender, location), click-through rate on description links, and average view duration. A verified media kit with auto-updating analytics is the most reliable source.
Most brands measure YouTube influencer campaigns the same way they measure Instagram or TikTok — check the views after 48 hours, calculate cost per view, and move on. This approach misses the majority of a YouTube campaign’s value.
YouTube is not a social feed. It is a search engine. Sponsored videos continue accumulating views through search results and recommendations for months or years after publishing. A 30-day measurement window captures only 40-60% of a video’s total lifetime views (InfluenceFlow, 2026). That means brands using short measurement windows are systematically undervaluing their best-performing campaigns — and overvaluing the worst ones.
The average ROI for influencer marketing is $5.20 per $1 spent, but YouTube campaigns that account for long-tail views consistently outperform this benchmark. Enterprise brands report average returns of 11:1 when they measure correctly (Amra & Elma, 2025). This is the framework for measuring YouTube influencer ROI the right way.
$5.20
Average return per $1 spent on influencer marketing
40-60%
Of total views captured in first 30 days on YouTube
11:1
ROI for enterprise brands measuring long-tail correctly
89%
Of marketers say influencer ROI ≥ other channels
The fundamental difference between YouTube and every other platform is content longevity. An Instagram Reel peaks within 48 hours. A TikTok video peaks within 24 hours. A YouTube video can generate views for years — especially if it ranks in search results.
This creates a measurement problem that most brands never solve: last-click attribution undervalues YouTube campaigns because viewers often convert days, weeks, or months after watching. A viewer sees a sponsored integration, searches for the product later, and converts through a Google ad — the YouTube creator gets zero credit.
Search
Evergreen discovery
Algorithm
Suggested & browse
External
Social, embeds, links
∞
Long-tail
YouTube videos accumulate views from three compounding sources — unlike social feeds where content dies after 48 hours.
Not every metric deserves your attention. Vanity metrics (total views, subscriber count) tell you almost nothing about campaign ROI. These six metrics, measured together, give you the complete picture.
The YouTube ROI Measurement Stack
#1
Audience Retention
What % of viewers watched past your product mention? This is the single most important metric — it tells you how many people actually saw the integration.
#2
True Views (Adjusted)
Total views × retention at mention timestamp = actual exposure. A 500K-view video with 45% retention at the sponsor segment = 225K true views.
#3
Engagement Rate
(Likes + comments) ÷ views × 100. Benchmark: 3-8% for nano, 2-5% for micro. Comments mentioning the sponsor product are the strongest conversion signal.
#4
Click-Through Rate
% of viewers who clicked the description link, end screen, or pinned comment. Track with UTM parameters per creator to attribute traffic exactly.
#5
Conversion Rate & CPA
Promo code redemptions + UTM-attributed purchases ÷ link clicks. Campaign cost ÷ total conversions = cost per acquisition. Target: below your average CAC.
#6
Long-Tail View Curve
Track views at day 7, 30, 90, and 365. YouTube videos typically earn 40-60% of lifetime views in the first 30 days. The rest is free ongoing exposure.
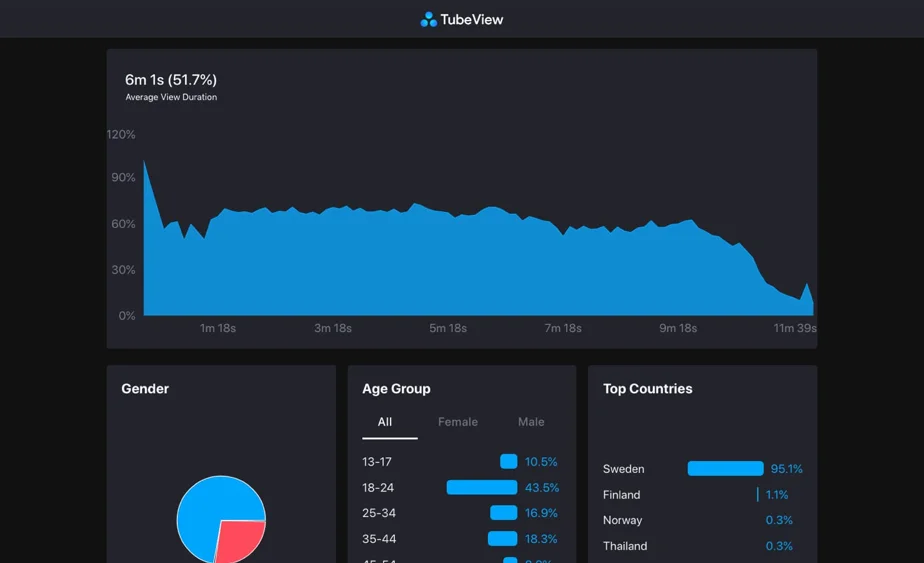
Audience retention is the single most important metric for YouTube sponsorships because it answers one question: did viewers actually see your product?
If the creator mentions your brand at the 4-minute mark of a 10-minute video and 60% of viewers dropped off by minute 3, only 40% of total views are real exposure. The YouTube algorithm also weights retention heavily — videos with high retention get recommended more, which compounds views over time.
🚩 Bad Retention
25%
at minute 6 of a 14-min video
75% of viewers never saw any mention past the opening minutes. If the sponsor segment is in the middle, the brand paid for views that never reached them. True exposure is a fraction of the view count.
✅ Strong Retention
52.7%
average across an 8m 45s video
More than half of viewers watched through the entire video. A sponsor mention at any point reached the majority of the audience. YouTube’s algorithm will recommend this video more aggressively.
The True Views formula: Total views × audience retention at sponsor mention timestamp = actual impressions your brand received. Always ask creators for their retention graph — not just their view count.
YouTube commands higher CPM (cost per thousand impressions) rates than other platforms, but the long-tail effect and higher viewer intent often make it the cheapest per converted view.
Average CPM by platform (cost per 1,000 impressions)
CPM
Platform
Source: InfluenceFlow 2026 Influencer Marketing Benchmarks
YouTube’s higher CPM is justified by three factors: longer watch time (8-15 minutes vs 15-60 seconds), higher purchase intent (43% of Gen Z report more loyalty to brands recommended by YouTube creators), and compounding views that reduce effective CPM over time. A video that costs $10,000 at $20 CPM on day 30 may deliver $10 CPM by day 180 as views continue accumulating.
The biggest mistake brands make is relying on a single attribution method. YouTube viewers rarely convert immediately — they watch, research, and buy later. You need multiple tracking layers to capture the full conversion path.
Give every creator a unique UTM-tagged link for their video description and pinned comment.
• utm_source: creator name (e.g., mkbhd)
• utm_medium: youtube
• utm_campaign: campaign name
• utm_content: video ID
Why it matters: UTM links are privacy-compliant, work with GA4, and let you see exactly which creator drove each site visit. Track page views, time on site, and conversions per UTM source.
Assign each creator a unique promo code (e.g., MKBHD20) that viewers mention at checkout.
• Captures delayed conversions — viewers who buy days or weeks after watching
• Works offline — promo codes track in-store and e-commerce purchases
• Cookie-independent — no expiration issue like affiliate links (typically 15-30 day windows)
Key tip: Make the code easy to remember and spell. Complex codes lose redemptions.
Use affiliate links alongside UTM links to attribute actual revenue per creator — not just traffic.
• Track: clicks, conversions, average order value, and revenue per creator
• Limitation: Cookie windows (15-30 days) miss late converters — combine with promo codes
• Best platforms: Impact, PartnerStack, ShareASale, or native Shopify affiliate tracking
Important: Use deep links so viewers land in-app rather than a browser login wall — this alone can increase conversion rates significantly.
Set up GA4 event tracking to see which YouTube referrals convert — even if they don't click a UTM link.
• Track referral traffic from youtube.com to measure organic mentions and linked visits
• Set up conversion events for purchases, sign-ups, or key actions
• Use assisted conversions report to see YouTube's role in multi-step purchase paths
Why this matters: Multi-touch attribution shows YouTube's true contribution. A viewer may discover your brand through a YouTube video, then convert via a Google search 2 weeks later — last-click gives Google the credit, but YouTube drove the awareness.
Measure campaign performance at multiple intervals — not just the first week.
• Day 7: Initial spike — compare to creator's average view velocity
• Day 30: Standard measurement window — most brands stop here (mistake)
• Day 90: Long-tail accumulation — often 30-50% more views than day 30
• Day 365: True lifetime value — evergreen videos can double their day-30 view count
Recalculate CPV at each checkpoint. A $10,000 campaign that looks expensive at day 30 often becomes your cheapest channel by day 365.
The standard influencer ROI formula needs one critical adjustment for YouTube: you must account for long-tail value.
YouTube Influencer ROI Framework
Standard ROI
(Revenue Generated − Campaign Cost) ÷ Campaign Cost × 100
Works for Instagram and TikTok where content peaks within 48 hours.
True YouTube ROI (Adjusted)
(Revenue at Day 30 + Projected Long-Tail Revenue) ÷ Campaign Cost × 100
Accounts for the 40-60% of views (and conversions) that come after the first 30 days.
True CPV (Cost Per True View)
Campaign Cost ÷ (Total Views × Retention at Sponsor Mention)
Adjust for audience retention to get the real cost per impression — the number of people who actually saw the integration.
Cost Per Acquisition (CPA)
Campaign Cost ÷ (UTM Conversions + Promo Code Redemptions)
The bottom-line metric. Compare this to your average CAC from paid ads to determine relative efficiency.
For the complete influencer marketing measurement framework covering all platforms, see our KPIs and metrics guide.
Campaign ROI Calculation — Real Example
Campaign: $5,000 for one sponsored integration
Mid-tier YouTube creator (150K subscribers) in the tech niche.
Day 30 results: 120K views, 55% retention at sponsor segment
True views = 120K × 0.55 = 66,000 true impressions. CPV = $5,000 ÷ 66,000 = $0.076.
Conversions: 340 UTM clicks → 28 purchases + 45 promo code redemptions
Total conversions = 73. CPA = $5,000 ÷ 73 = $68.49 per acquisition.
Day 180: 195K views → 118 total conversions
Adjusted CPA = $5,000 ÷ 118 = $42.37. The video accumulated 62% more views and conversions after the initial 30-day window — for zero additional spend.
Key insight: If this brand measured only at day 30, they’d report a CPA of $68 — above their $50 target. By day 180, the actual CPA was $42 — one of their best-performing channels.
Measuring only total views — a 500K-view video with 20% retention at the sponsor segment delivered only 100K true impressions
Using last-click attribution alone — 73% of brands struggle to measure ROI because they don't track multi-touch paths
Stopping measurement at 30 days — this systematically undervalues evergreen YouTube content
Ignoring audience demographics — a creator whose audience is 80% outside your target market delivers low-quality views regardless of volume
Comparing YouTube CPM directly to TikTok/IG CPM — YouTube's higher CPM is offset by longer watch time, higher intent, and long-tail compounding
Use multiple attribution layers — UTM links + promo codes + GA4 event tracking to capture the full conversion path
Measure at 30, 90, and 365 days — a 30-day window captures only half the value of most YouTube campaigns
Calculate True Views using the retention graph — total views × retention at sponsor mention = actual impressions
Compare CPA to paid ads — if YouTube influencer CPA is below your Google/Meta CAC, scale the channel
Request verified analytics — use a creator's live media kit instead of unverified screenshots
Measurement starts before the first video goes live. Set up these systems before the creator publishes so you capture every data point from day one.
Pre-Campaign Measurement Setup
Vet the creator with data, not follower count
Check average retention rate, engagement rate, audience demographics, and traffic sources. Use our guide on identifying the right influencers and request a verified media kit.
Generate unique UTM links and promo codes
One unique UTM link and one unique promo code per creator. Include in the brief with clear placement instructions (description, pinned comment, verbal mention).
Set up GA4 conversion events
Configure goal tracking for purchases, sign-ups, or whatever your conversion event is. Set up a saved segment for YouTube referral traffic to monitor ongoing performance.
Set measurement checkpoints in your calendar
Schedule ROI reviews at day 7, 30, 90, and 365. Most brands forget — calendar reminders ensure you capture long-tail value and can use the data for future budget allocation.
You don’t need enterprise software to measure YouTube campaigns properly. The right combination of free and affordable tools covers everything.
Verified creator analytics dashboard with auto-updating engagement rates, audience demographics, and growth data across YouTube, Instagram, and TikTok. Share live media kits with brands for transparent, up-to-date metrics.
Track UTM-tagged traffic, set up conversion events, and use multi-touch attribution reports to see YouTube's full contribution to your conversion funnel.
The source of truth for audience retention graphs, traffic source breakdowns, audience demographics, and real-time view data. Creators should share these directly — not screenshots.
Deep links that open YouTube content directly in the app. Use for YouTube deep linking to maximize click-through from external traffic sources.
This guide covers YouTube-specific measurement. For the complete influencer marketing measurement framework covering all platforms, KPI selection by campaign objective, and ROI calculation templates, read Influencer Marketing Measurement: KPIs, Metrics, and ROI.
For YouTube-specific pricing so you know what to budget, see YouTube influencer pricing. To find and vet YouTube creators before launching a campaign, read how to find YouTubers to collaborate with and our guide on identifying the right influencers for your brand.
MySocial gives brands verified creator analytics, auto-updating media kits, and reporting dashboards — so you can evaluate YouTube creators with real data, not guesswork.
Explore creator analyticsInfluencer Marketing Strategy
Related Posts
How to manage influencer relationships that drive results -- from creative briefs to communication plans that prevent campaign disasters.

Why brands are shifting budgets to influencer marketing -- and the 4 traditional marketing problems it solves better than ads.
YouTube influencer rates by tier. CPM pricing, format costs, usage rights, budget allocation, and negotiation frameworks for 2026.